Create a new variable that is the difference of two adjacent rows of ‘price’ variable in the data set, where the new variable is the squared difference.
test <- data.frame(id = c(6, 16, 26, 36, 46, 56),
                    house = c(1, 5, 10, 23, 25, 27),
                    price = c(79, 84, 36, 34, 21, 12))
where the new variable is diff = (79-84)^2 , (36-34)^2, (21-12)^2
The desired output would look like:
diff.data <- data.frame(price_diff = c(25, 4, 81))
I am trying to use the brackets to isolate the first and second rows, and take the difference and square, and repeat this over, for rows three and four, etc. but appreciate tips on how to approach this.
5 Answers
A few approaches that come to mind.
dplyr
For quick work, a dplyr approach, which has the handy lag() and lead() functions. First makes calculations for each row, then subsets to every other row, then pulls the calculated column.
library(dplyr)

test %>%
    mutate(diff = (price - lead(price))^2) %>%
    slice(seq(1, nrow(.), 2)) %>%
    pull(diff)
[1] 25 4 81
base R
A base R approach, with fun recycled logical subsetting. This one is very clearly a vectorized operation, so naturally is the fastest.
(test$price[c(TRUE, FALSE)] - test$price[c(FALSE, TRUE)])^2
[1] 25 4 81
for loop
An inefficient-but-it-works approach:
inds <- seq(1, nrow(test), 2)
diff <- numeric(length(inds))

for (i in seq_along(inds)) {
    diff[i] <- (test$price[inds[i]] - test$price[inds[i] + 1])^2
}

diff
[1] 25 4 81
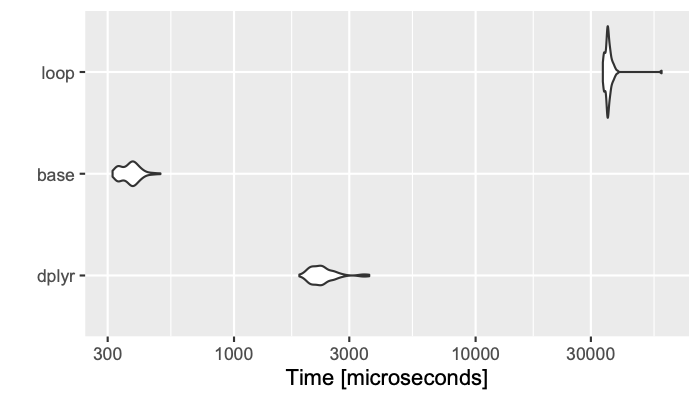
Benchmarks
library(microbenchmark)
test_big <- data.frame(price = rnorm(100000, mean(test$price)))

res <- microbenchmark(
    dplyr = {
        diff1 <- test_big %>%
            mutate(diff = (price - lead(price))^2) %>%
            slice(seq(1, nrow(.), 2)) %>%
            pull(diff)
    },
    base = {
        diff2 <- (test_big$price[c(TRUE, FALSE)] - test_big$price[c(FALSE, TRUE)])^2
    },
    loop = {
        inds <- seq(1, nrow(test_big), 2)
        diff3 <- numeric(length(inds))
        for (i in seq_along(inds)) {
            diff3[i] <- (test_big$price[inds[i]] - test_big$price[inds[i] + 1])^2
        }
    }
)

all(c(identical(diff1, diff2), identical(diff2, diff3)))
print(res)
[1] TRUE
Unit: microseconds
  expr       min       lq       mean     median         uq       max neval
 dplyr  1864.352  2118.08  2338.2370  2274.1060  2443.4360  3628.295   100
  base   314.306   346.04   372.9717   374.7605   391.6115   495.895   100
  loop 33623.116 34868.37 35641.7231 35273.2225 35975.5525 58852.630   100
ggplot2::autoplot(res)
0
Here’s one solution with a for loop. Not efficient but it might be good enough.
test <- data.frame(id = c(6, 16, 26, 36, 46, 56),
                   house = c(1, 5, 10, 23, 25, 27),
                   price = c(79, 84, 36, 34, 21, 12))

index = seq(1,nrow(test)-1,by=2)
price_diff<-c()
for(i in index){
  tmp<-test[c(i,i+1),]$price
  price_diff[i] <- (tmp[2]-tmp[1])^2
}
return(price_diff)
Here is a data.table solution:
library(data.table)

DTt <- data.table(test)
DTt[, diff(price)^2, ][c(T,F)] # this line is added to microbenchmarking as "DT"
optimised base R 1 variant
(diff(test[, "price"])^2)[c(T,F)] # "base2"
and optimised base R 2 variant
(diff(test$price)^2)[c(T,F)] # "base3"
Using microbenchmarking from @knitz3 answer:
> print(res)
Unit: microseconds
  expr     min       lq      mean   median       uq      max neval cld
 dplyr  2921.2  3273.40  3889.982  3471.40  3877.70  17523.4   100 a
  base   260.1   287.00   434.685   329.80   435.95   7442.6   100  b
  loop 53704.1 55269.00 58833.461 56131.30 59930.90 206869.4   100   c
    DT   226.3   247.15   315.890   315.70   372.15    431.6   100  b
 base2    14.2    21.30    31.647    25.15    34.00     94.4   100  b
 base3     7.5    11.40    20.489    16.90    31.40     48.1   100  b
1
-
Nice use of
diff()! Really takes the cake– knitz316 hours ago
df <- data.frame(id = c(6, 16, 26, 36, 46, 56),
                 house = c(1, 5, 10, 23, 25, 27),
                 price = c(79, 84, 36, 34, 21, 12))

library(tidyverse)
df %>%
  mutate(diff_price = c(0, diff(price) ^ 2)) %>%
  filter((row_number() - 1) %% 2 == 1)
#>   id house price diff_price
#> 1 16     5    84         25
#> 2 36    23    34          4
#> 3 56    27    12         81
Created on 2023-11-07 with reprex v2.0.2
0
Try crossprod
> with(test, data.frame(price_diff = c(crossprod(c(1, -1), matrix(price, 2)))^2))
  price_diff
1         25
2          4
3         81


