Currently using graphene-python with graphene-django (and graphene-django-optimizer).
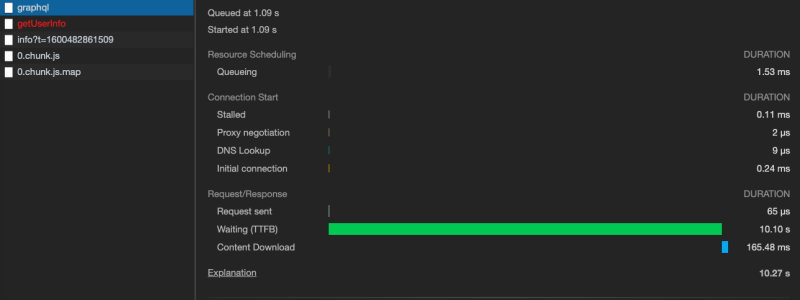
After receiving a GraphQL query, the database query is successfully completed in a fraction of a second; however, graphene doesn’t send a response for another 10+ seconds. If I increase the data being sent in the response, the response time increases linearly (triple the data = triple the response time).
The data being retrieved composed of nested objects, up to 7 layers deep, but with the optimized queries this doesn’t impact the time taken to retrieve the data from the DB, so I’m assuming the delay has to do with graphene-python parsing the results into the GraphQL response.
I can’t figure out how to profile the execution to determine what is taking so long — running cProfiler on Django doesn’t seem to be tracking the execution of graphene.
SQL Query response time was determined using the graphene-django-debugger middleware, results are shown below:
    "_debug": {
  "sql": [
    {
      "duration": 0.0016078948974609375,
      "isSlow": false,
      "rawSql": "SELECT SYSDATETIME()"
    },
    {
      "duration": 0.0014908313751220703,
      "isSlow": false,
      "rawSql": "SELECT [redacted]"
    },
    {
      "duration": 0.0014371871948242188,
      "isSlow": false,
      "rawSql": "SELECT [redacted]"
    },
    {
      "duration": 0.001291036605834961,
      "isSlow": false,
      "rawSql": "SELECT [redacted]"
    },
    {
      "duration": 0.0013201236724853516,
      "isSlow": false,
      "rawSql": "SELECT [redacted]"
    },
    {
      "duration": 0.0015559196472167969,
      "isSlow": false,
      "rawSql": "SELECT [redacted]"
    },
    {
      "duration": 0.0016672611236572266,
      "isSlow": false,
      "rawSql": "SELECT [redacted]"
    },
    {
      "duration": 0.0014820098876953125,
      "isSlow": false,
      "rawSql": "SELECT [redacted]"
    },
    {
      "duration": 0.0014810562133789062,
      "isSlow": false,
      "rawSql": "SELECT [redacted]"
    },
    {
      "duration": 0.001667022705078125,
      "isSlow": false,
      "rawSql": "SELECT [redacted]"
    },
    {
      "duration": 0.0014202594757080078,
      "isSlow": false,
      "rawSql": "SELECT [redacted]"
    },
    {
      "duration": 0.0027959346771240234,
      "isSlow": false,
      "rawSql": "SELECT [redacted]"
    },
    {
      "duration": 0.002704143524169922,
      "isSlow": false,
      "rawSql": "SELECT [redacted]"
    },
    {
      "duration": 0.0030939579010009766,
      "isSlow": false,
      "rawSql": "SELECT [redacted]"
    }
  ]
}
The screenshot below shows the server’s corresponding response time for that same request:
If anyone knows why graphene would take so long to create the response or could assist me with profiling the execution of graphene, I’d greatly appreciate it!
5
2 Answers
Try using a better profiler like Silk, it will show you a breakdown based on queries Django fires to the DB, as well as a neat cProfiler overview. I would suspect an issue in extraneous DB calls. Graphene tends to make Django do a lot of per-field calls while constructing the response and they might not be showing up in the debugger response.
Without more information on the setup – models, resolvers and graphql queries – it’s very hard to judge.
The problem with the graphene-django is that having multiple queries or mutations resolve slowly since it works on a single thread and process.
You may also want to read this. Also reading about the N+1 issue.
It does not create another process to make it faster and it resolves them one by one since it has been finished with the whole request. We also had this problem with one of our projects.
We found that using strawberry is a better choice since it handles the request more gently and in a more performant way, also supports type hints and you can use mypy with this package very easily, and has the mypy plugin built-in.
Also, I suggest that you update your question and provide a little more information about the queries and schemas and your resolver functions.


What is the graphql query?
Aug 4, 2022 at 14:46
Update question with resolvers and types. GraphQL is known to perform slow on deeper relations.
Oct 4, 2022 at 16:10
I would also suspect it being a resolver issue
Oct 5, 2022 at 6:53
How are you setting up the profiler? Could you try the WSGI profiling middleware from the Pallets Project werkzeug.palletsprojects.com/en/2.2.x/middleware/profiler
Nov 4, 2022 at 11:00
Did you every figure out a solution, @techknowfile?
Dec 8 at 20:02