I am using artillery node JS based tool for performance testing with yml based scenario.
I have installed all the plugin library
I am able to run artillery test
But I am not able to see logs for what is wrong in my graph ql request and what is response.
I tried to set DEBUG=http,https:request,https:response
I am using windows and I tried on windows command prompt and window powershell
Can someone please help me to understand where to see what went wrong or debug logs
Below is my yml code
config:
  target: 'https:test.dev.demo.io'
  plugins:
    ensure: {}
    expect: {}
    metrics-by-endpoint:
      useOnlyRequestNames: true
      metricsNamespace: "latency_metrics"
  phases:
    - duration: 1
      arrivalRate: 1
scenarios:
- name: "Get Bill Status"
  flow:
    - log: "Get Bill Status GRAPH QL Test running"
    - get:
        url: "/graphql"
        headers: {
            Authorization: "bearer f32tb20190ac1abd0a24a6e27cf124f9f7308a65592b8a72a5115995edc32277"
            }
        expect:
            - statusCode: 200
        json:
            query: |
              query {
                getApiV1BillRequestIdStatus(requestId: "e9e5a487-4c55-48cc-853d-1bd9466db53d"}) {
                  code
                  data
                  message
                }
              }
        capture:
          - json: $.code
            as: status_code
Windows command prompt I tried below command-
set DEBUG=http
artillery run my-script.yml
Windows powershell prompt I tried below command-
$Env:DEBUG = ‘http’
artillery run my-script.yml
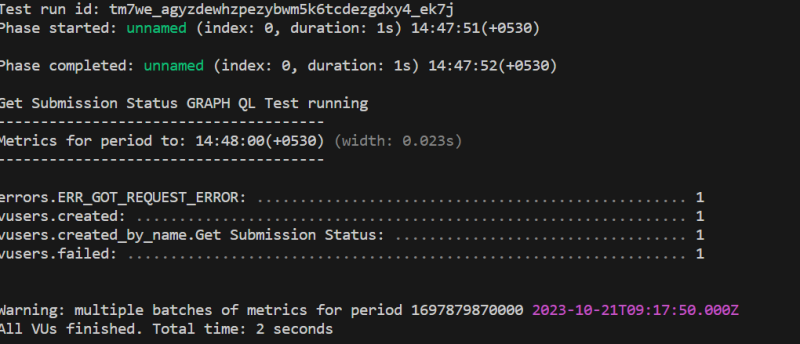
I am seeing output as below

